Tell us how we can help you?
Name
Country
Email
Phone
Message
Receive updates on WhatsApp
By tapping submit, you agree to Machine Learning Plus Privacy Policy & Terms & Conditions

Get a detailed look at our Data Science course
  • Comprehensive Learning Paths
  • 150+ Hours of Videos
  • Complete Access to Jupyter notebooks, Datasets, References.
Rating
4.89/5
Ratings
Users
57K+
Active Learners
Full Name
Email
Phone
Country
I would like to be kept up to date with new training programs/events/promotions/marketing.
By submitting this form, I accept Machine Learning Plus Privacy Policy.

Request A Call Back
Please leave us your contact details and our team will call you back.
Name
Country
Email
Phone
Message
Receive updates on WhatsApp
By tapping submit, you agree to Machine Learning Plus Privacy Policy & Terms & Conditions

Skip to content
MLP Logo
Menu
  • Courses
    • Data Science Coding Expert
      • Foundations Of Machine Learning (Free)
      • Python Programming(Free)
      • Numpy For Data Science(Free)
      • Pandas For Data Science(Free)
      • Linux Command Line(Free)
      • SQL for Data Science – I(Free)
      • SQL for Data Science – II(Free)
      • SQL for Data Science – III(Free)
      • SQL for Data Science – Window Functions(Free)
      • Machine Learning Expert
      • Linear Algebra for ML
      • Statistics for Data Science
      • Data Pre-Processing and EDA
      • Linear Regression and Regularisation
      • Classification: Logistic Regression
      • Supervised ML Algorithms
      • Imbalanced Classification
      • Ensemble Learning
      • Time Series Forecasting Expert
      • Introduction to Time Series Analysis
      • Time Series Analysis – I (Beginners)
      • Time Series Analysis – II (Intermediate)
      • Time Series Forecasting Part 1 – Statistical Models
      • Time Series Forecasting Part 2 – ARIMA modeling and Tests
      • Time Series Forecasting Part 3 – Vector Auto Regression
      • Time Series Analysis – III: Singular Spectrum Analysis
      • Feature Engineering for Time Series Projects – Part 1
      • Feature Engineering for Time Series Projects – Part 2
    • Deployment Expert
      • ML Deployment in AWS EC2
      • Deploy ML Models in AWS Lamda
      • Deploy ML Models in AWS Sagemaker
      • PySpark for Data Science – I: Fundamentals
      • PySpark for Data Science – II: Statistics for Big Data
      • PySpark for Data Science – III: Data Cleaning and Analysis
      • PySpark for Data Science – IV: Machine Learning
      • PySpark for Data Science-V : ML Pipelines
      • Deep Learning Expert
      • Foundations Of Deep Learning in Python
      • Foundations Of Deep Learning in Python 2
      • Applied Deep Learning with PyTorch
      • Detecting Defects in Steel Sheets with Computer-Vision
      • Project Text Generation using Language Models with LSTM
      • Project Classifying Sentiment of Reviews using BERT NLP
    • Industry Projects Expert
      • Estimating Customer Lifetime Value for Business
      • Microsoft Malware Detection Project
      • Credit Card Fraud Detection
      • Restaurant Visitor Forecasting
      • Optimizing Marketing Budget Spend with Market Mix Modelling
      • Predict Rating given Amazon Product Reviews using NLP
      • Uplift modeling: Estimating incremental impact of Marketing Campaigns
      • Uplift Modeling Part 2: Modeling-Strategies
      • Survival Analysis: Predicting Time to Event in real world applications
      • Survival Analysis Part 2: Predicting Time to Event for Lungs Cancer Patients
      • Attribution Models in Marketing
      • Dynamic pricing using Multi Armed Bandit (Reinforcement Learning)
      • Reinforcement learning for Online Ad Serving with Multi Armed Bandits
      • MLFlow in Action: Hands on guide to ML experiments
    • Supplementary Courses
      • Base R Programming
      • Dplyr for Data Wrangling
      • Wrangling Data with DataTable
      • GGPlot2 Visualization for Data Analysis
      • Statistical Foundations for ML in R
      • Statistical Modeling with Linear Logistics Regression
      • Caret package in R
      • Spacy for NLP
      • View All Courses
    • Close
  • Blog
    • Resources-old
      • Data Science Project Template
      • Time Series Project Template
      • Numpy Cheatsheets
      • Data Science Projects Bluebook
      • All Resources
    • Practice Exercises
      • 101 NumPy Exercises for Data Analysis (Python)
      • 101 Pandas Exercises for Data Analysis
      • 101 PySpark Exercises for Data Analysis
      • 101 Python datatable Exercises (pydatatable)
      • 101 NLP Exercises (using modern libraries)
      • 101 R data.table Exercises
    • Python
      • Setup Python environment for ML
      • How to speed up Python using Cython
      • Python to Cython in Jupyter
      • How to deal with Big Data in Python for ML Projects (100+ GB)?
      • Decorators in Python – How to enhance functions without changing the code?
      • Generators in Python – How to lazily return values only when needed and save memory?
      • Iterators in Python – What are Iterators and Iterables?
      • Python Module – What are modules and packages in python?
      • Object Oriented Programming (OOPS) in Python
      • Conda virtual environment
      • List Comprehensions in Python – My Simplified Guide
      • Parallel Processing in Python – A Practical Guide with Examples
      • Python @Property Explained – How to Use and When? (Full Examples)
      • pdb – How to use Python debugger
      • Python Regular Expressions Tutorial and Examples: A Simplified Guide
      • Python Logging – Simplest Guide with Full Code and Examples
      • datetime in Python – Simplified Guide with Clear Examples
      • Requests in Python Tutorial – How to send HTTP requests in Python?
      • Python JSON – Guide
      • Python Collections – An Introductory Guide
      • cProfile – How to profile your python code
      • Python Yield – What does the yield keyword do?
      • Lambda Function in Python – How and When to use?
      • What does Python Global Interpreter Lock – (GIL) do?
    • Time Series
      • Granger Causality Test
      • Augmented Dickey Fuller Test (ADF Test) – Must Read Guide
      • KPSS Test for Stationarity
      • ARIMA Model – Complete Guide to Time Series Forecasting in Python
      • Time Series Analysis in Python – A Comprehensive Guide with Examples
      • Vector Autoregression (VAR) – Comprehensive Guide with Examples in Python
    • Statistics
      • Partial Correlation
      • Chi-Square test – How to test statistical significance?
      • Gentle Introduction to Markov Chain
      • What is P-Value? – Understanding the meaning, math and methods
      • How to implement common statistical significance tests and find the p value?
      • Mahalanobis Distance – Understanding the math with examples (python)
      • T Test (Students T Test) – Understanding the math and how it works
      • Confidence Interval – Fully Explained
      • Understanding Standard Error – A practical guide with examples
      • One Sample T Test – Clearly Explained with Examples | ML+
    • Deep Learning
      • TensorFlow vs PyTorch – A Detailed Comparison
      • How to use tf.function to speed up Python code in Tensorflow
      • How to implement Linear Regression in TensorFlow
    • NLP
      • Complete Guide to Natural Language Processing (NLP) – with Practical Examples
      • Text Summarization Approaches for NLP – Practical Guide with Generative Examples
      • 101 NLP Exercises (using modern libraries)
      • Gensim Tutorial – A Complete Beginners Guide
      • LDA in Python – How to grid search best topic models?
      • Topic Modeling with Gensim (Python)
      • Lemmatization Approaches with Examples in Python
      • Topic modeling visualization – How to present the results of LDA models?
      • Cosine Similarity – Understanding the math and how it works (with python codes)
      • spaCy Tutorial – Complete Writeup
      • Training Custom NER models in SpaCy to auto-detect named entities [Complete Guide]
      • Building chatbot with Rasa and spaCy
      • SpaCy Text Classification – How to Train Text Classification Model in spaCy (Solved Example)?
    • Plots
      • Matplotlib Plotting Tutorial – Complete overview of Matplotlib library
      • Matplotlib Histogram – How to Visualize Distributions in Python
      • Bar Plot in Python – How to compare Groups visually
      • Python Boxplot – How to create and interpret boxplots (also find outliers and summarize distributions)
      • Waterfall Plot in Python
      • Top 50 matplotlib Visualizations – The Master Plots (with full python code)
      • Matplotlib Tutorial – A Complete Guide to Python Plot w/ Examples
      • Matplotlib Pyplot – How to import matplotlib in Python and create different plots
      • Python Scatter Plot – How to visualize relationship between two numeric features
      • Matplotlib Line Plot – How to create a line plot to visualize the trend?
      • Matplotlib Subplots – How to create multiple plots in same figure in Python?
    • Machine Learning
      • Main Pitfalls in Machine Learning Projects
      • Deploy ML model in AWS Ec2 – Complete no-step-missed guide
      • Feature selection using FRUFS and VevestaX
      • Simulated Annealing Algorithm Explained from Scratch (Python)
      • Bias Variance Tradeoff – Clearly Explained
      • Complete Introduction to Linear Regression in R
      • Caret Package – A Practical Guide to Machine Learning in R
      • Logistic Regression – A Complete Tutorial With Examples in R
      • Principal Component Analysis (PCA) – Better Explained
      • K-Means Clustering Algorithm from Scratch
      • How Naive Bayes Algorithm Works? (with example and full code)
      • Feature Selection – Ten Effective Techniques with Examples
      • Evaluation Metrics for Classification Models – How to measure performance of machine learning models?
      • Brier Score – How to measure accuracy of probablistic predictions
      • Portfolio Optimization with Python using Efficient Frontier with Practical Examples
      • Gradient Boosting – A Concise Introduction from Scratch
    • Deployment
      • Population Stability Index (PSI)
      • Deploy ML model in AWS Ec2 – Complete no-step-missed guide
    • Julia
      • Julia – Programming Language
      • Linear Regression in Julia
      • Logistic Regression in Julia – Practical Guide with Examples
      • For-Loop in Julia
      • While-loop in Julia
      • Function in Julia
      • DataFrames in Julia
    • Data Wrangling
      • 101 NumPy Exercises for Data Analysis (Python)
      • 101 Pandas Exercises for Data Analysis
      • SQL Tutorial – A Simple and Intuitive Guide to the Structured Query Language
      • Dask – How to handle large dataframes in python using parallel computing
      • Modin – How to speedup pandas by changing one line of code
      • Python Numpy – Introduction to ndarray [Part 1]
      • data.table in R – The Complete Beginners Guide
      • 101 Python datatable Exercises (pydatatable)
      • 101 R data.table Exercises
      • 101 NLP Exercises (using modern libraries)
    • Recent
      • How to deal with Big Data in Python for ML Projects (100+ GB)?
      • Granger Causality Test
      • Main Pitfalls in Machine Learning Projects
      • Population Stability Index (PSI)
      • Deploy ML model in AWS Ec2 – Complete no-step-missed guide
      • Feature selection using FRUFS and VevestaX
      • Object Oriented Programming (OOPS) in Python
      • Simulated Annealing Algorithm Explained from Scratch (Python)
      • Partial Correlation
      • Chi-Square test – How to test statistical significance for categorical data?
      • Conda virtual environment
  • Pricing
  • Testimonials
  • Product
    • Complete Data Science Course (CDS)
      • Data Science Specializations >
        • DS Programming Specialization
        • Machine Learning Specialization
        • Deployment Specialization
        • Forecasting Specialization
        • DS Projects Specialization
        • Deep Learning Specialization
        • Supplementary Courses
    • Projects
    • Store🛒
Menu
  • Blog
    • Resources-old
      • Data Science Project Template
      • Time Series Project Template
      • Numpy Cheatsheets
      • Data Science Projects Bluebook
      • All Resources
    • Practice Exercises
      • 101 NumPy Exercises for Data Analysis (Python)
      • 101 Pandas Exercises for Data Analysis
      • 101 PySpark Exercises for Data Analysis
      • 101 Python datatable Exercises (pydatatable)
      • 101 NLP Exercises (using modern libraries)
      • 101 R data.table Exercises
    • Python
      • Setup Python environment for ML
      • How to speed up Python using Cython
      • Python to Cython in Jupyter
      • How to deal with Big Data in Python for ML Projects (100+ GB)?
      • Decorators in Python – How to enhance functions without changing the code?
      • Generators in Python – How to lazily return values only when needed and save memory?
      • Iterators in Python – What are Iterators and Iterables?
      • Python Module – What are modules and packages in python?
      • Object Oriented Programming (OOPS) in Python
      • Conda virtual environment
      • List Comprehensions in Python – My Simplified Guide
      • Parallel Processing in Python – A Practical Guide with Examples
      • Python @Property Explained – How to Use and When? (Full Examples)
      • pdb – How to use Python debugger
      • Python Regular Expressions Tutorial and Examples: A Simplified Guide
      • Python Logging – Simplest Guide with Full Code and Examples
      • datetime in Python – Simplified Guide with Clear Examples
      • Requests in Python Tutorial – How to send HTTP requests in Python?
      • Python JSON – Guide
      • Python Collections – An Introductory Guide
      • cProfile – How to profile your python code
      • Python Yield – What does the yield keyword do?
      • Lambda Function in Python – How and When to use?
      • What does Python Global Interpreter Lock – (GIL) do?
    • Time Series
      • Granger Causality Test
      • Augmented Dickey Fuller Test (ADF Test) – Must Read Guide
      • KPSS Test for Stationarity
      • ARIMA Model – Complete Guide to Time Series Forecasting in Python
      • Time Series Analysis in Python – A Comprehensive Guide with Examples
      • Vector Autoregression (VAR) – Comprehensive Guide with Examples in Python
    • Statistics
      • Partial Correlation
      • Chi-Square test – How to test statistical significance?
      • Gentle Introduction to Markov Chain
      • What is P-Value? – Understanding the meaning, math and methods
      • How to implement common statistical significance tests and find the p value?
      • Mahalanobis Distance – Understanding the math with examples (python)
      • T Test (Students T Test) – Understanding the math and how it works
      • Confidence Interval – Fully Explained
      • Understanding Standard Error – A practical guide with examples
      • One Sample T Test – Clearly Explained with Examples | ML+
    • Deep Learning
      • TensorFlow vs PyTorch – A Detailed Comparison
      • How to use tf.function to speed up Python code in Tensorflow
      • How to implement Linear Regression in TensorFlow
    • NLP
      • Complete Guide to Natural Language Processing (NLP) – with Practical Examples
      • Text Summarization Approaches for NLP – Practical Guide with Generative Examples
      • 101 NLP Exercises (using modern libraries)
      • Gensim Tutorial – A Complete Beginners Guide
      • LDA in Python – How to grid search best topic models?
      • Topic Modeling with Gensim (Python)
      • Lemmatization Approaches with Examples in Python
      • Topic modeling visualization – How to present the results of LDA models?
      • Cosine Similarity – Understanding the math and how it works (with python codes)
      • spaCy Tutorial – Complete Writeup
      • Training Custom NER models in SpaCy to auto-detect named entities [Complete Guide]
      • Building chatbot with Rasa and spaCy
      • SpaCy Text Classification – How to Train Text Classification Model in spaCy (Solved Example)?
    • Plots
      • Matplotlib Plotting Tutorial – Complete overview of Matplotlib library
      • Matplotlib Histogram – How to Visualize Distributions in Python
      • Bar Plot in Python – How to compare Groups visually
      • Python Boxplot – How to create and interpret boxplots (also find outliers and summarize distributions)
      • Waterfall Plot in Python
      • Top 50 matplotlib Visualizations – The Master Plots (with full python code)
      • Matplotlib Tutorial – A Complete Guide to Python Plot w/ Examples
      • Matplotlib Pyplot – How to import matplotlib in Python and create different plots
      • Python Scatter Plot – How to visualize relationship between two numeric features
      • Matplotlib Line Plot – How to create a line plot to visualize the trend?
      • Matplotlib Subplots – How to create multiple plots in same figure in Python?
    • Machine Learning
      • Main Pitfalls in Machine Learning Projects
      • Deploy ML model in AWS Ec2 – Complete no-step-missed guide
      • Feature selection using FRUFS and VevestaX
      • Simulated Annealing Algorithm Explained from Scratch (Python)
      • Bias Variance Tradeoff – Clearly Explained
      • Complete Introduction to Linear Regression in R
      • Caret Package – A Practical Guide to Machine Learning in R
      • Logistic Regression – A Complete Tutorial With Examples in R
      • Principal Component Analysis (PCA) – Better Explained
      • K-Means Clustering Algorithm from Scratch
      • How Naive Bayes Algorithm Works? (with example and full code)
      • Feature Selection – Ten Effective Techniques with Examples
      • Evaluation Metrics for Classification Models – How to measure performance of machine learning models?
      • Brier Score – How to measure accuracy of probablistic predictions
      • Portfolio Optimization with Python using Efficient Frontier with Practical Examples
      • Gradient Boosting – A Concise Introduction from Scratch
    • Deployment
      • Population Stability Index (PSI)
      • Deploy ML model in AWS Ec2 – Complete no-step-missed guide
    • Julia
      • Julia – Programming Language
      • Linear Regression in Julia
      • Logistic Regression in Julia – Practical Guide with Examples
      • For-Loop in Julia
      • While-loop in Julia
      • Function in Julia
      • DataFrames in Julia
    • Data Wrangling
      • 101 NumPy Exercises for Data Analysis (Python)
      • 101 Pandas Exercises for Data Analysis
      • SQL Tutorial – A Simple and Intuitive Guide to the Structured Query Language
      • Dask – How to handle large dataframes in python using parallel computing
      • Modin – How to speedup pandas by changing one line of code
      • Python Numpy – Introduction to ndarray [Part 1]
      • data.table in R – The Complete Beginners Guide
      • 101 Python datatable Exercises (pydatatable)
      • 101 R data.table Exercises
      • 101 NLP Exercises (using modern libraries)
    • Recent
      • How to deal with Big Data in Python for ML Projects (100+ GB)?
      • Granger Causality Test
      • Main Pitfalls in Machine Learning Projects
      • Population Stability Index (PSI)
      • Deploy ML model in AWS Ec2 – Complete no-step-missed guide
      • Feature selection using FRUFS and VevestaX
      • Object Oriented Programming (OOPS) in Python
      • Simulated Annealing Algorithm Explained from Scratch (Python)
      • Partial Correlation
      • Chi-Square test – How to test statistical significance for categorical data?
      • Conda virtual environment
  • Pricing
  • Testimonials
  • Product
    • Complete Data Science Course (CDS)
      • Data Science Specializations >
        • DS Programming Specialization
        • Machine Learning Specialization
        • Deployment Specialization
        • Forecasting Specialization
        • DS Projects Specialization
        • Deep Learning Specialization
        • Supplementary Courses
    • Projects
    • Store🛒
Login
  • Getting Started
    • #1. How to formulate machine learning problem
    • #2. Setup Python environment for ML
    • #3. Exploratory Data Analysis (EDA)
    • #4. How to reduce the memory size of Pandas Data frame
    • #5. Missing Data Imputation Approaches
    • #6. Interpolation in Python
    • #7. MICE imputation
    • #8. How to detect outliers using IQR and Boxplots?
    • #9. How to detect outliers with z-score
  • Beginners Corner
    • How to formulate machine learning problem
    • Setup Python environment for ML
    • What is a Data Scientist?
    • The story of how Data Scientists came into existence
    • Task Checklist for Almost Any Machine Learning Project
    • Data Science Roadmap (2023)
    • Why learn the math behind Machine Learning and AI?
    • Mistakes programmers make when starting machine learning
    • Machine Learning Use Cases
    • How to deal with Big Data in Python for ML Projects (100+ GB)?
    • Main Pitfalls in Machine Learning Projects
  • Courses
    • 1. Foundations of Machine Learning
    • 2. Python Programming
    • 3. NumPy for Data Science
    • 4. Pandas for Data Science
    • 5. Linux Command
    • 6. SQL for Data Science – Level 1
    • 7. SQL for Data Science – Level 2
    • 8. SQL for Data Science – Level 3
    • 9. SQL for Data Science – Window Functions
    • 10. Data Pre-processing and EDA
    • 11. Linear regression and regularisation
    • 12. Classification: Logistic Regression
    • 13. Imbalanced Classification
    • 14. Supervised ML Algorithms
    • 15. Ensemble Learning
    • 16. ML Deployment in AWS EC2
    • 17. Deploy in AWS Lamda
    • 18. Deploy in AWS Sagemaker
    • 19. PySpark for Data Science – I: Fundamentals
    • 20. PySpark for Data Science – II: Statistics for Big Data
    • 21. Introduction to Time Series Analaysis
    • 22. Time Series Analysis – I (Beginners)
    • 23. Time Series Analysis – II (Intermediate )
    • 24. Time Series Forecasting Part 1: Statistical Models
    • 25. Time Series Forecasting Part 2: ARIMA modeling and Tests
    • 26. Time Series Forecasting Part 3: Vector Auto Regression
    • 27. Time Series Analysis – III: Singular Spectrum Analysis
    • 28. Feature Engineering for Time Series Project: I
    • 29. Feature Engineering for Time Series Projects: II
    • 31. Estimating customer lifetime value for business
    • 32. Microsoft malware detection project
    • 33. Credit card fraud detection
    • 34. Restaurant Visitor Forecasting
    • 35. Optimizing Marketing Budget Spend with Marketing Mix Modeling
    • 36. Predict Rating given Amazon Product review using NLP
    • 37. Foundations of Deep Learning in Python
    • 38. Foundations of Deep Learning: Part 2
    • 39. Applied Deep Learning with PyTorch
    • 40. Detecting defects in Steel sheet with Computer vision
    • 41. Project Text Generation using Language models with LSTM
    • 42. Project Classifying Sentiment of reviews using BERT NLP
    • 43. Spacy for NLP
    • 44. Base R Programming
    • 45. Dplyr for Data Wrangling
    • 46. Wrangling Data with Data Table
    • 47. GGPlot2 Visualization for Data Analysis
    • 48. Statistical foundation for ML in R
    • 49. Regression Model in R
    • 50. Caret Package in R
  • Python
    • Introduction to Python
      • Setup Python environment for ML
      • Decorators in Python
      • Generators in Python
      • Iterators in Python
      • Python Module
      • Object Oriented Programming (OOPS) in Python
      • List Comprehension
      • Requests in Python
      • Python Collections
      • Python Logging
    • Plots
      • Matplotlib Tutorial
      • Matplotlib Histogram
      • Bar Plot in Python
      • Python Boxplot
      • Waterfall Plot in Python
      • Top 50 matplotlib Visualizations
      • Matplotlib Tutorial
      • Matplotlib Pyplot
      • Python Scatter Plot
      • Matplotlib Subplots
    • Data Wrangling
      • 101 NumPy Exercises for Data Analysis (Python)
      • 101 Pandas Exercises for Data Analysis
      • 101 Pandas Exercises for Data Analysis
      • Dask
      • Modin
      • Numpy Tutorial
      • data.table in R
      • 101 Python datatable Exercises (pydatatable)
      • 101 R data.table Exercises
    • Advanced Python
      • Conda create environment and everything you need to know to manage conda virtual environment
      • Python @Property Explained
      • pdb – How to use Python debugger
      • Python JSON – Guide
      • cProfile – How to profile your python code
      • Python Yield
      • Lambda Function in Python
      • What does Python Global Interpreter Lock
      • Install opencv python
      • Install pip mac
      • Scrapy vs. Beautiful Soup
      • Add Python to PATH
    • PySpark
      • Introduction to Pyspark
      • Power of Pyspark
      • Install PySpark on Windows
      • Install PySpark on MAC
      • Install PySpark on Linux
      • What is Sparksession
      • Read and Write files using PySpark
      • Pyspark Show
      • Run SQL Queries with PySpark
      • PySpark Pandas API
      • Select columns in PySpark dataframe
      • PySpark withColumn()
      • Pyspark Drop Columns
      • PySpark Rename Columns
      • PySpark Filter vs Where
      • PySpark orderBy() and sort()
      • PySpark GroupBy()
      • PySpark Pivot
      • PySpark Joins
      • PySpark Union
      • PySpark Connect to MySQL
      • PySpark Connect to PostgreSQL
      • PySpark Connect to SQL Serve
      • PySpark Connect to Redshift
      • PySpark Connect to Snowflake
      • PySpark Linear Regression
      • PySpark Logistic Regression
      • PySpark Decision Tree
      • PySpark Ridge Regression
      • PySpark Lasso Regression
      • PySpark Random Forest
      • PySpark Gradient Boosting model
      • PySpark Mllib K-Means Clustering
      • PySpark Statistics Mean
      • PySpark Statistics Median
      • PySpark Statistics Mode
      • PySpark Statistics Standard Deviation
      • PySpark Statistics Variance
      • PySpark Statistics Deciles and Quartiles
      • PySpark Correlation
      • PySpark Chi-Square Test
      • PySpark Variable type Identification
      • PySpark Outlier Detection and Treatment
      • PySpark Missing Data Imputation
      • PySpark Variance Inflation Factor (VIF)
      • PySpark StringIndexer
      • PySpark OneHot Encoding
      • PySpark Exercises – 101 PySpark Exercises for Data Analysis
      • Others
        • Deployment
          • Population Stability Index (PSI)
          • Deploy ML model in AWS Ec2
        • Julia
          • Julia – Programming Language
          • Linear Regression in Julia
          • Logistic Regression in Julia
          • For-Loop in Julia
          • While-loop in Julia
          • Function in Julia
          • DataFrames in Julia
        • Linux
          • ls command in Linux – Mastering the “ls” command in Linux
          • mkdir command in Linux – A comprehensive guide for mkdir command
          • cd command in linux – Mastering the ‘cd’ command in Linux
          • cat command in Linux – Mastering the ‘cat’ command in Linux
          • Linux Commands List with Examples
  • Machine Learning
    • Deep Learning
      • TensorFlow vs PyTorch
      • How to use tf.function to speed up Python code in Tensorflow
      • How to implement Linear Regression in TensorFlow
    • NLP
      • Complete Guide to Natural Language Processing (NLP)
      • Text Summarization Approaches for NLP
      • 101 NLP Exercises (using modern libraries)
      • Gensim Tutorial
      • LDA in Python
      • Topic Modeling with Gensim (Python)
      • Lemmatization Approaches with Examples in Python
      • Topic modeling visualization
      • Cosine Similarity
      • spaCy Tutorial
      • Training Custom NER models in SpaCy to auto-detect named entities
      • Building chatbot with Rasa and spaCy
      • SpaCy Text Classification
    • Algorithms
      • K-Means Clustering Algorithm from Scratch
      • Simulated Annealing Algorithm Explained from Scratch
      • How Naive Bayes Algorithm Works?
      • Feature selection using FRUFS and VevestaX
      • Principal Component Analysis
      • Gradient Boosting
      • Feature Selection – Ten Effective Techniques with Examples
    • Projects
      • Evaluation Metrics for Classification Models
      • Deploy ML model in AWS Ec2
      • Portfolio Optimization with Python using Efficient Frontier
      • Bias Variance Tradeoff
    • Specific Topics
      • Logistic Regression
      • Complete Introduction to Linear Regression in R
      • Caret Package
      • Brier Score
  • Time Series
    • Granger Causality Test
    • Augmented Dickey Fuller Test (ADF Test)
    • KPSS Test for Stationarity
    • ARIMA Model
    • Time Series Analysis in Python
    • Vector Autoregression (VAR)
  • Prob and Stats
    • Probability
      • Introduction to Probability
      • Odds and Odds Ratios
      • Independent and Dependent Events
      • Mutually Exclusive Events
      • Joint Probability
      • Conditional Probability
      • Bayes’ Theorem
      • Expected Value
      • Probability frequency distribution
      • Discrete Frequency Distributions
      • Continuous Frequency Distributions
    • Partial Correlation
    • Chi-Square Test – Theory & Math
    • Gentle Introduction to Markov Chain
    • What is P-Value?
    • How to implement common statistical significance tests and find the p value?
    • Mahalanobis Distance
    • T Test (Students T Test)
    • Confidence Interval in Statistics
    • Standard Error in Statistics
    • One Sample T Test
    • Descriptive and inferential statistics
    • Types of data in statistics
    • Measures of central tendency
    • Quantiles and Percentiles
    • Measures of dispersion
    • Skewness and kurtosis
    • Central Limit Theroem
    • Law of large numbers
    • Standard Error
    • Sampling and sampling distributions
    • Correlation
  • SQL
    • SQL Tutorial – The Introduction
    • SQL Subquery (advanced)
    • SQL Window Functions (advanced)
    • SQL Window Functions Exercises – Set 1
    • SQL Window Functions Exercises – Set 2
    • Intro to SQL
    • SQL Select
    • SQL Select Distinct
    • SQL Where
    • SQL Order by
    • SQL Insert Into
    • SQL AND, OR, and NOT
    • SQL Null Values
    • SQL Update
    • SQL DELETE
    • SQL SELECT TOP
    • SQL MIN and MAX Functions
    • SQL Count(), Avg(), Sum()
    • SQL LIKE
    • SQL Wildcards
    • SQL IN
    • SQL BETWEEN
    • SQL Aliases
    • SQL Joins
    • SQL Inner Join
    • SQL Left Join
    • SQL Right Join
    • SQL Full Join
    • SQL Self Join
    • SQL UNION
    • SQL GROUP BY
    • SQL HAVING
    • SQL EXISTS
    • SQL ANY, ALL Operators
    • How to transpose columns to rows in SQL?
    • How to select only rows with max value on a column?
    • SQL Select Into
    • SQL Insert Into Select
    • SQL Case
    • SQL Null Functions
    • SQL Comments
    • SQL Operators
    • SQL Create Table
    • SQL Drop Table
    • SQL Primary Key
    • SQL Foreign Key
    • Sort multiple columns in SQL and in different directions?
    • Count the number of work days between two dates?
    • Compute maximum of multiple columns, aks row wise max?
    • GROUP BY clause on multiple columns in SQL?
  • Linear Algebra
    • 01. Introduction to Linear Algebra
    • 02. Types of Tensors
    • 03. Scalars
    • 04. Vectors
    • 05. Vectors Linear Algebra
    • 06. Matrix Types
    • 07. Matrix Operations
    • 08. Orthogonal and Ortrhonormal Matrix
    • 09. Eigenvectors and Eigenvalues
    • 10. Affine Transformation
    • 11. Singular Value Decomposition (SVD)
    • 12. System of Equations
    • 13. Linear Regression Algorithm
    • 14. Principal Component Analysis
Menu
  • Getting Started
    • #1. How to formulate machine learning problem
    • #2. Setup Python environment for ML
    • #3. Exploratory Data Analysis (EDA)
    • #4. How to reduce the memory size of Pandas Data frame
    • #5. Missing Data Imputation Approaches
    • #6. Interpolation in Python
    • #7. MICE imputation
    • #8. How to detect outliers using IQR and Boxplots?
    • #9. How to detect outliers with z-score
  • Beginners Corner
    • How to formulate machine learning problem
    • Setup Python environment for ML
    • What is a Data Scientist?
    • The story of how Data Scientists came into existence
    • Task Checklist for Almost Any Machine Learning Project
    • Data Science Roadmap (2023)
    • Why learn the math behind Machine Learning and AI?
    • Mistakes programmers make when starting machine learning
    • Machine Learning Use Cases
    • How to deal with Big Data in Python for ML Projects (100+ GB)?
    • Main Pitfalls in Machine Learning Projects
  • Courses
    • 1. Foundations of Machine Learning
    • 2. Python Programming
    • 3. NumPy for Data Science
    • 4. Pandas for Data Science
    • 5. Linux Command
    • 6. SQL for Data Science – Level 1
    • 7. SQL for Data Science – Level 2
    • 8. SQL for Data Science – Level 3
    • 9. SQL for Data Science – Window Functions
    • 10. Data Pre-processing and EDA
    • 11. Linear regression and regularisation
    • 12. Classification: Logistic Regression
    • 13. Imbalanced Classification
    • 14. Supervised ML Algorithms
    • 15. Ensemble Learning
    • 16. ML Deployment in AWS EC2
    • 17. Deploy in AWS Lamda
    • 18. Deploy in AWS Sagemaker
    • 19. PySpark for Data Science – I: Fundamentals
    • 20. PySpark for Data Science – II: Statistics for Big Data
    • 21. Introduction to Time Series Analaysis
    • 22. Time Series Analysis – I (Beginners)
    • 23. Time Series Analysis – II (Intermediate )
    • 24. Time Series Forecasting Part 1: Statistical Models
    • 25. Time Series Forecasting Part 2: ARIMA modeling and Tests
    • 26. Time Series Forecasting Part 3: Vector Auto Regression
    • 27. Time Series Analysis – III: Singular Spectrum Analysis
    • 28. Feature Engineering for Time Series Project: I
    • 29. Feature Engineering for Time Series Projects: II
    • 31. Estimating customer lifetime value for business
    • 32. Microsoft malware detection project
    • 33. Credit card fraud detection
    • 34. Restaurant Visitor Forecasting
    • 35. Optimizing Marketing Budget Spend with Marketing Mix Modeling
    • 36. Predict Rating given Amazon Product review using NLP
    • 37. Foundations of Deep Learning in Python
    • 38. Foundations of Deep Learning: Part 2
    • 39. Applied Deep Learning with PyTorch
    • 40. Detecting defects in Steel sheet with Computer vision
    • 41. Project Text Generation using Language models with LSTM
    • 42. Project Classifying Sentiment of reviews using BERT NLP
    • 43. Spacy for NLP
    • 44. Base R Programming
    • 45. Dplyr for Data Wrangling
    • 46. Wrangling Data with Data Table
    • 47. GGPlot2 Visualization for Data Analysis
    • 48. Statistical foundation for ML in R
    • 49. Regression Model in R
    • 50. Caret Package in R
  • Python
    • Introduction to Python
      • Setup Python environment for ML
      • Decorators in Python
      • Generators in Python
      • Iterators in Python
      • Python Module
      • Object Oriented Programming (OOPS) in Python
      • List Comprehension
      • Requests in Python
      • Python Collections
      • Python Logging
    • Plots
      • Matplotlib Tutorial
      • Matplotlib Histogram
      • Bar Plot in Python
      • Python Boxplot
      • Waterfall Plot in Python
      • Top 50 matplotlib Visualizations
      • Matplotlib Tutorial
      • Matplotlib Pyplot
      • Python Scatter Plot
      • Matplotlib Subplots
    • Data Wrangling
      • 101 NumPy Exercises for Data Analysis (Python)
      • 101 Pandas Exercises for Data Analysis
      • 101 Pandas Exercises for Data Analysis
      • Dask
      • Modin
      • Numpy Tutorial
      • data.table in R
      • 101 Python datatable Exercises (pydatatable)
      • 101 R data.table Exercises
    • Advanced Python
      • Conda create environment and everything you need to know to manage conda virtual environment
      • Python @Property Explained
      • pdb – How to use Python debugger
      • Python JSON – Guide
      • cProfile – How to profile your python code
      • Python Yield
      • Lambda Function in Python
      • What does Python Global Interpreter Lock
      • Install opencv python
      • Install pip mac
      • Scrapy vs. Beautiful Soup
      • Add Python to PATH
    • PySpark
      • Introduction to Pyspark
      • Power of Pyspark
      • Install PySpark on Windows
      • Install PySpark on MAC
      • Install PySpark on Linux
      • What is Sparksession
      • Read and Write files using PySpark
      • Pyspark Show
      • Run SQL Queries with PySpark
      • PySpark Pandas API
      • Select columns in PySpark dataframe
      • PySpark withColumn()
      • Pyspark Drop Columns
      • PySpark Rename Columns
      • PySpark Filter vs Where
      • PySpark orderBy() and sort()
      • PySpark GroupBy()
      • PySpark Pivot
      • PySpark Joins
      • PySpark Union
      • PySpark Connect to MySQL
      • PySpark Connect to PostgreSQL
      • PySpark Connect to SQL Serve
      • PySpark Connect to Redshift
      • PySpark Connect to Snowflake
      • PySpark Linear Regression
      • PySpark Logistic Regression
      • PySpark Decision Tree
      • PySpark Ridge Regression
      • PySpark Lasso Regression
      • PySpark Random Forest
      • PySpark Gradient Boosting model
      • PySpark Mllib K-Means Clustering
      • PySpark Statistics Mean
      • PySpark Statistics Median
      • PySpark Statistics Mode
      • PySpark Statistics Standard Deviation
      • PySpark Statistics Variance
      • PySpark Statistics Deciles and Quartiles
      • PySpark Correlation
      • PySpark Chi-Square Test
      • PySpark Variable type Identification
      • PySpark Outlier Detection and Treatment
      • PySpark Missing Data Imputation
      • PySpark Variance Inflation Factor (VIF)
      • PySpark StringIndexer
      • PySpark OneHot Encoding
      • PySpark Exercises – 101 PySpark Exercises for Data Analysis
      • Others
        • Deployment
          • Population Stability Index (PSI)
          • Deploy ML model in AWS Ec2
        • Julia
          • Julia – Programming Language
          • Linear Regression in Julia
          • Logistic Regression in Julia
          • For-Loop in Julia
          • While-loop in Julia
          • Function in Julia
          • DataFrames in Julia
        • Linux
          • ls command in Linux – Mastering the “ls” command in Linux
          • mkdir command in Linux – A comprehensive guide for mkdir command
          • cd command in linux – Mastering the ‘cd’ command in Linux
          • cat command in Linux – Mastering the ‘cat’ command in Linux
          • Linux Commands List with Examples
  • Machine Learning
    • Deep Learning
      • TensorFlow vs PyTorch
      • How to use tf.function to speed up Python code in Tensorflow
      • How to implement Linear Regression in TensorFlow
    • NLP
      • Complete Guide to Natural Language Processing (NLP)
      • Text Summarization Approaches for NLP
      • 101 NLP Exercises (using modern libraries)
      • Gensim Tutorial
      • LDA in Python
      • Topic Modeling with Gensim (Python)
      • Lemmatization Approaches with Examples in Python
      • Topic modeling visualization
      • Cosine Similarity
      • spaCy Tutorial
      • Training Custom NER models in SpaCy to auto-detect named entities
      • Building chatbot with Rasa and spaCy
      • SpaCy Text Classification
    • Algorithms
      • K-Means Clustering Algorithm from Scratch
      • Simulated Annealing Algorithm Explained from Scratch
      • How Naive Bayes Algorithm Works?
      • Feature selection using FRUFS and VevestaX
      • Principal Component Analysis
      • Gradient Boosting
      • Feature Selection – Ten Effective Techniques with Examples
    • Projects
      • Evaluation Metrics for Classification Models
      • Deploy ML model in AWS Ec2
      • Portfolio Optimization with Python using Efficient Frontier
      • Bias Variance Tradeoff
    • Specific Topics
      • Logistic Regression
      • Complete Introduction to Linear Regression in R
      • Caret Package
      • Brier Score
  • Time Series
    • Granger Causality Test
    • Augmented Dickey Fuller Test (ADF Test)
    • KPSS Test for Stationarity
    • ARIMA Model
    • Time Series Analysis in Python
    • Vector Autoregression (VAR)
  • Prob and Stats
    • Probability
      • Introduction to Probability
      • Odds and Odds Ratios
      • Independent and Dependent Events
      • Mutually Exclusive Events
      • Joint Probability
      • Conditional Probability
      • Bayes’ Theorem
      • Expected Value
      • Probability frequency distribution
      • Discrete Frequency Distributions
      • Continuous Frequency Distributions
    • Partial Correlation
    • Chi-Square Test – Theory & Math
    • Gentle Introduction to Markov Chain
    • What is P-Value?
    • How to implement common statistical significance tests and find the p value?
    • Mahalanobis Distance
    • T Test (Students T Test)
    • Confidence Interval in Statistics
    • Standard Error in Statistics
    • One Sample T Test
    • Descriptive and inferential statistics
    • Types of data in statistics
    • Measures of central tendency
    • Quantiles and Percentiles
    • Measures of dispersion
    • Skewness and kurtosis
    • Central Limit Theroem
    • Law of large numbers
    • Standard Error
    • Sampling and sampling distributions
    • Correlation
  • SQL
    • SQL Tutorial – The Introduction
    • SQL Subquery (advanced)
    • SQL Window Functions (advanced)
    • SQL Window Functions Exercises – Set 1
    • SQL Window Functions Exercises – Set 2
    • Intro to SQL
    • SQL Select
    • SQL Select Distinct
    • SQL Where
    • SQL Order by
    • SQL Insert Into
    • SQL AND, OR, and NOT
    • SQL Null Values
    • SQL Update
    • SQL DELETE
    • SQL SELECT TOP
    • SQL MIN and MAX Functions
    • SQL Count(), Avg(), Sum()
    • SQL LIKE
    • SQL Wildcards
    • SQL IN
    • SQL BETWEEN
    • SQL Aliases
    • SQL Joins
    • SQL Inner Join
    • SQL Left Join
    • SQL Right Join
    • SQL Full Join
    • SQL Self Join
    • SQL UNION
    • SQL GROUP BY
    • SQL HAVING
    • SQL EXISTS
    • SQL ANY, ALL Operators
    • How to transpose columns to rows in SQL?
    • How to select only rows with max value on a column?
    • SQL Select Into
    • SQL Insert Into Select
    • SQL Case
    • SQL Null Functions
    • SQL Comments
    • SQL Operators
    • SQL Create Table
    • SQL Drop Table
    • SQL Primary Key
    • SQL Foreign Key
    • Sort multiple columns in SQL and in different directions?
    • Count the number of work days between two dates?
    • Compute maximum of multiple columns, aks row wise max?
    • GROUP BY clause on multiple columns in SQL?
  • Linear Algebra
    • 01. Introduction to Linear Algebra
    • 02. Types of Tensors
    • 03. Scalars
    • 04. Vectors
    • 05. Vectors Linear Algebra
    • 06. Matrix Types
    • 07. Matrix Operations
    • 08. Orthogonal and Ortrhonormal Matrix
    • 09. Eigenvectors and Eigenvalues
    • 10. Affine Transformation
    • 11. Singular Value Decomposition (SVD)
    • 12. System of Equations
    • 13. Linear Regression Algorithm
    • 14. Principal Component Analysis

PySpark Statistics Deciles and Quartiles – Understanding Deciles and Quartiles a Deep Dive with PySpark

Join thousands of students who advanced their careers with MachineLearningPlus. Go from Beginner to Data Science Expert through a structured road map of 70+ courses in 9 core specializations. Build industry grade Data Science projects.

Learn more
  • May 3, 2023
  • Jagdeesh

Let’s dive into the concept of deciles and quartiles and how to calculate them in PySpark.

When analyzing data, it’s important to understand the distribution of the data. One way to do this is by calculating the deciles and quartiles.

What are Deciles?

Deciles divide a set of data into 10 equal parts. For example, the first decile (D1) is the point at which 10% of the data is below that point, the second decile (D2) is the point at which 20% of the data is below that point, and so on, up to the 10th decile (D10), which is the point at which 100% of the data is below that point.

What are Quartiles?

Quartiles divide a set of data into 4 equal parts. The first quartile (Q1) is the point at which 25% of the data is below that point, the second quartile (Q2) is the point at which 50% of the data is below that point (also known as the median), and the third quartile (Q3) is the point at which 75% of the data is below that point.

Importance of Deciles and Quartiles in Statistics and Machine Learning

Deciles and percentiles are measures of relative standing in a dataset, dividing the data into equal parts. They are essential tools in statistics and machine learning for summarizing, analyzing, and comparing data. Here are some common uses of deciles and percentiles in both fields:

1. Identify central tendencies: Deciles help determine the median (5th decile), which is a measure of central tendency that can be more robust to outliers than the mean.

2. Assess data dispersion: By calculating the decile range (9th decile – 1st decile), you can measure the dispersion or spread of the data, providing insights into the variability within the dataset.

3. Compare datasets or groups: Deciles can be used to compare different datasets or groups by examining their decile values and how they are distributed.

4. Identify trends and patterns: Deciles help to reveal trends and patterns within the data, which can inform decision-making and further analysis.

5. Segment data: Deciles can be used to segment data into groups, such as dividing a population into income or performance groups, for targeted analysis or interventions.

6. Detect outliers: By examining extreme decile values, you can identify potential outliers in the dataset.

1. Import required libraries and initialize SparkSession

First, let’s import the necessary libraries and create a SparkSession, the entry point to use PySpark.

import findspark
findspark.init()

from pyspark import SparkFiles
from pyspark.sql import SparkSession
from pyspark.sql.functions import mean, stddev, col

spark = SparkSession.builder.appName("Deciles and Quantiles").getOrCreate()

2. Preparing the Sample Data

To demonstrate the different methods of calculating the Deciles and Quantiles, we’ll use a sample dataset containing three columns. First, let’s load the data into a DataFrame:

url = "https://raw.githubusercontent.com/selva86/datasets/master/Iris.csv"
spark.sparkContext.addFile(url)

df = spark.read.csv(SparkFiles.get("Iris.csv"), header=True, inferSchema=True)
df.show(5)
+---+-------------+------------+-------------+------------+-----------+
| Id|SepalLengthCm|SepalWidthCm|PetalLengthCm|PetalWidthCm|    Species|
+---+-------------+------------+-------------+------------+-----------+
|  1|          5.1|         3.5|          1.4|         0.2|Iris-setosa|
|  2|          4.9|         3.0|          1.4|         0.2|Iris-setosa|
|  3|          4.7|         3.2|          1.3|         0.2|Iris-setosa|
|  4|          4.6|         3.1|          1.5|         0.2|Iris-setosa|
|  5|          5.0|         3.6|          1.4|         0.2|Iris-setosa|
+---+-------------+------------+-------------+------------+-----------+
only showing top 5 rows

3. How to calculate deciles and quantiles Using approxQuantile on a single column

you can calculate deciles and quantiles using the approxQuantile function, which is available in the DataFrame API. Here are three different ways to calculate deciles and quantiles using PySpark

# Calculate the deciles (10-quantiles) for the "Value" column
deciles = df.approxQuantile("SepalLengthCm", [x / 10 for x in range(1, 10)], 0.0)

# Calculate the quantiles (4-quantiles) for the "Value" column
quantiles = df.approxQuantile("SepalLengthCm", [0.25, 0.5, 0.75], 0.0)

print("Deciles:", deciles)
print("Quantiles:", quantiles)
Deciles: [4.8, 5.0, 5.2, 5.6, 5.8, 6.1, 6.3, 6.5, 6.9]
Quantiles: [5.1, 5.8, 6.4]

4. How to calculate deciles and quantiles Using approxQuantile on multiple columns

# Calculate deciles and quantiles for multiple columns
deciles = {}
quantiles = {}

for col in ["SepalLengthCm", "PetalLengthCm"]:
    deciles[col] = df.approxQuantile(col, [x / 10 for x in range(1, 10)], 0.0)
    quantiles[col] = df.approxQuantile(col, [0.25, 0.5, 0.75], 0.0)

print("Deciles:", deciles)
print("Quantiles:", quantiles)
Deciles: {'SepalLengthCm': [4.8, 5.0, 5.2, 5.6, 5.8, 6.1, 6.3, 6.5, 6.9], 'PetalLengthCm': [1.4, 1.5, 1.7, 3.9, 4.3, 4.6, 5.0, 5.3, 5.8]}
Quantiles: {'SepalLengthCm': [5.1, 5.8, 6.4], 'PetalLengthCm': [1.6, 4.3, 5.1]}

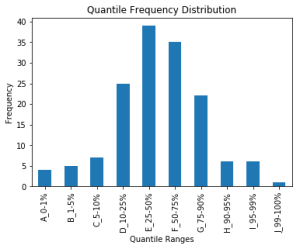
5. Deciles and Quantiles use case

By examining quantile frequency distribution and extreme quantile values, you can identify potential outliers in the dataset
and also identfy the skewness in the data

import pyspark.sql.functions as F
import matplotlib.pyplot as plt
import pandas as pd

column_name = "SepalLengthCm"
quantiles = [0.0, 0.01, 0.05, 0.10, 0.25, 0.5, 0.75, 0.90, 0.95, 0.99, 1.0]
quantile_values = df.approxQuantile(column_name, quantiles, 0.001)

print(quantile_values)
[4.3, 4.4, 4.6, 4.8, 5.1, 5.8, 6.4, 6.9, 7.3, 7.7, 7.9]

Create a new DataFrame with the quantile values and their corresponding frequency.

quantile_frequency = df.select(F.when(F.col(column_name).between(quantile_values[0], quantile_values[1]), "A_0-1%")
                                .when(F.col(column_name).between(quantile_values[1], quantile_values[2]), "B_1-5%")
                                .when(F.col(column_name).between(quantile_values[2], quantile_values[3]), "C_5-10%")
                                .when(F.col(column_name).between(quantile_values[3], quantile_values[4]), "D_10-25%")
                                .when(F.col(column_name).between(quantile_values[4], quantile_values[5]), "E_25-50%")
                                .when(F.col(column_name).between(quantile_values[5], quantile_values[6]), "F_50-75%")
                                .when(F.col(column_name).between(quantile_values[6], quantile_values[7]), "G_75-90%")
                                .when(F.col(column_name).between(quantile_values[7], quantile_values[8]), "H_90-95%")
                                .when(F.col(column_name).between(quantile_values[8], quantile_values[9]), "I_95-99%")
                                .otherwise("J_99-100%")
                                .alias("quantile_range"))

quantile_frequency_count = quantile_frequency.groupBy("quantile_range").count().orderBy("quantile_range").toPandas()

display(quantile_frequency_count)
quantile_range count
0 A_0-1% 4
1 B_1-5% 5
2 C_5-10% 7
3 D_10-25% 25
4 E_25-50% 39
5 F_50-75% 35
6 G_75-90% 22
7 H_90-95% 6
8 I_95-99% 6
9 J_99-100% 1
quantile_frequency_count.plot(x="quantile_range", y="count", kind="bar", legend=None)
plt.xlabel("Quantile Ranges")
plt.ylabel("Frequency")
plt.title("Quantile Frequency Distribution")
plt.show()

Conclusion

Deciles and quartiles are important measures of the distribution of data. In PySpark, we can easily calculate these measures using the approxQuantile method from the pyspark.sql.functions module.

More Articles

  • PySpark

PySpark Exercises – 101 PySpark Exercises for Data Analysis

May 19, 2023
  • PySpark

PySpark OneHot Encoding – Mastering OneHot Encoding in PySpark and Unleash the Power of Categorical Data in Machine Learning

May 08, 2023
  • PySpark

PySpark StringIndexer – A Comprehensive Guide to master PySpark StringIndexer

  • PySpark

PySpark Outlier Detection and Treatment – A Comprehensive Guide How to handle Outlier in PySpark

May 07, 2023
  • PySpark

PySpark Missing Data Imputation – How to handle missing values in PySpark

  • PySpark

PySpark Variable type Identification – A Comprehensive Guide to Identifying Discrete, Categorical, and Continuous Variables in Data

May 05, 2023

Similar Articles

Complete Introduction to Linear Regression in R

Selva Prabhakaran 12/03/2017 7 Comments
Read More »

How to implement common statistical significance tests and find the p value?

Selva Prabhakaran 13/03/2017 3 Comments
Read More »

Logistic Regression – A Complete Tutorial With Examples in R

Selva Prabhakaran 13/09/2017 24 Comments
Read More »

Subscribe to Machine Learning Plus for high value data science content

Linkedin Twitter Youtube Instagram
  • Resources
  • Blogs
  • Courses
  • Store
  • List of Blogs
Menu
  • Resources
  • Blogs
  • Courses
  • Store
  • List of Blogs
  • Project Bluebook
  • Time Series Template
Menu
  • Project Bluebook
  • Time Series Template
  • About us
  • Terms of Use
  • Privacy Policy
  • Contact Us
  • Refund Policy
Menu
  • About us
  • Terms of Use
  • Privacy Policy
  • Contact Us
  • Refund Policy

© Machinelearningplus. All rights reserved.

  • 01-What is Machine Learning Model
  • 02-Data in ML (Garbage in Garbage Out)
  • 03-Types of ML problems
  • 04-Types of ML Problems Part 2
  • 05-Types of ML Problems Part-3
  • 06-Sales and Marketing Use Cases
  • 07-Logistics, production, HR & customer support use cases
  • 08-What ML Can and Cannot Do
  • 09-Data Science vs ML vs AI vs Deep Learning vs Statistical Modeling
  • 10-Introduction to ML Project Workflow
  • 11-Discover
  • 12-Design
  • 13-Develop
  • 14-Testing
  • 15-Deploy
  • 16-Interpreting ML Models
  • 17-Interpreting ML Models Part-1
  • 18-Interpreting ML Models Part-2
  • 19-How to Validate ML Models
  • 20-Need for Validation Sample
  • 21-ML Terminology Part-1
  • 22-ML Terminology Part-2
  • 23-ML Terminology Part-3
  • 24-What is Ensemble Learning
  • 25-Reinforcement Learning Intuition
  • 26-Basic Statistical Concepts Part-1
  • 27-Basic Statistical Concepts Part-2
  • 28- Role of Significance Tests
  • About us
  • Arima
    • 1-Understanding ARIMA
    • 2-Building AR Model
    • 3-Building MA Model
    • 4-Implement ARIMA
    • 5-Forecast with ARIMA and Test Results
  • Blog
  • Computer Vision Case Study
  • Contact Us
  • Demo Videos
    • Chi Square Test
    • Exploratory Data Analysis – Microsoft Malware Detection
    • Representing Missing Values
  • Do Epic Stuff with Data Science
  • Events
    • Data Science Bootcamp DSB
    • Introduction to SQL for Data Science
    • Python Bootcamp
    • Python Bootcamp
  • Gentle Introduction to Markov Chain
  • Jobs
  • Kabir Singh
  • Kaustubh Gupta
  • Landing Page Style Nine
  • Leena
  • Linear Regression in Julia
  • List of Blogs
  • Live
  • Live Course Request Demo
  • Live Data Science Program
  • Machine Learning Plus
  • Machine Learning Plus | Learn Data Science – Python, R, Stats, ML
  • Machine Learning Plus | Learn everything about Python, R, Data Science and AI – Old Design
  • New Landing Page
  • Pranay Lawhatre
  • Privacy Policy
  • Python Collections – An Introductory Guide
  • Python JSON – Guide
  • Refund Policy
  • Shreyansh
  • Shrivarsheni
  • spaCy Tutorial – Complete Writeup
  • subscribe
  • Terms of Use
  • Test Page – To be deleted
  • Test Page for Scaler
  • Test Page for Scaler Iframe
  • Testimonial landing page
  • Testimonial of Chris
  • Testimonial of D Stroy
  • Testimonial of Golda
  • Testimonial of Haris
  • Testimonial of Jayshree
  • Testimonial of Joy
  • Testimonial of Robert
  • Testimonials
  • Testimonials
  • Thank you for Signing Up
  • Venmani
  • Waterfall Plot in Python
  • What it takes to be a Data Scientist at Microsoft
  • 1-Scaling and standardizaation
  • 3-Representing Missing Values
  • 5-Approaches to Filling Missing Data
  • Approach Real Business Problem
  • Attend a Free Class to Experience The MLPlus Industry Data Science Program
  • Attend a Free Class to Experience The MLPlus Industry Data Science Program -IN
  • NOT USED-ARIMA Time Series Forecasting
  • Resources – Data Science Project Template
  • Resources – Data Science Projects Bluebook
  • Resources – Numpy Cheatsheets
  • Resources – Time Series Project Template
  • Useful Function in Numpy
 

Loading Comments...
 

    test

    Connect with us

    YouTube Twitter Instagram Linkedin Facebook

    Get our new articles, videos and live sessions info.

    Join 54,000+ fine folks. Stay as long as you'd like. Unsubscribe anytime.

    We Accept

    Payment-Cards
    • Footer Logo

      Learn and master Data Science, AI/ML

    • About

      • About Us
      • Terms of Use
      • Privacy Policy
      • Refund Policy
    • ROADMAP

      • 1. The Complete Roadmap
      • 2. Programming for DS
      • 3. ML Algorithms
      • 4. ML Ops
      • 5.Deep Learning
      • 6. Time Series
      • 7. DS Industry Projects
      • 8. Supplementary Courses
    • OFFERINGS

      • All Courses
      • Complete Univ Access
      • Industry DS Projects
      • Youtube
      • List of Blogs
      • 30 Day DS Interviews Prep
      • Tasklist for DS Projects
      • Jobs
    • HELP

      • Drop a Query
      • FAQ's
      • Contact Us
      • Testimonials
      • Subscribe to newsletter

    Copyright 2025 | All Rights Reserved by machinelearningplus

    • Privacy Policy
    • Terms of service
    • Terms & Conditions
     

    Loading Comments...
     

      test